03.24.2017
IPR Trends Q1 2017: Patent and Trademark Statistics1
SHARE
BY JACK T. W. WEI
In the first quarter (Q1) of 2017, 17,670 new patent applications were filed, which marks a 6% growth compared to Q1 of 2016. Meanwhile, a 5% growth of new trademark registrations has been registered, corresponding to 18,976 cases. The relevant data is summarized hereunder in Table 1.
Table 1 Patent and Trademark Applications–Residents and Non-Residents.
For further analysis, applicants of new applications are further categorized as shown in Figures 1-3 and Table 2.
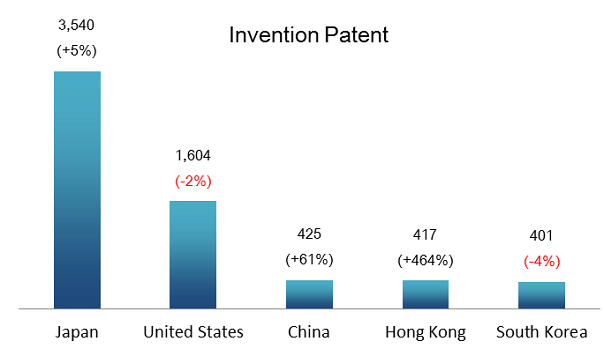
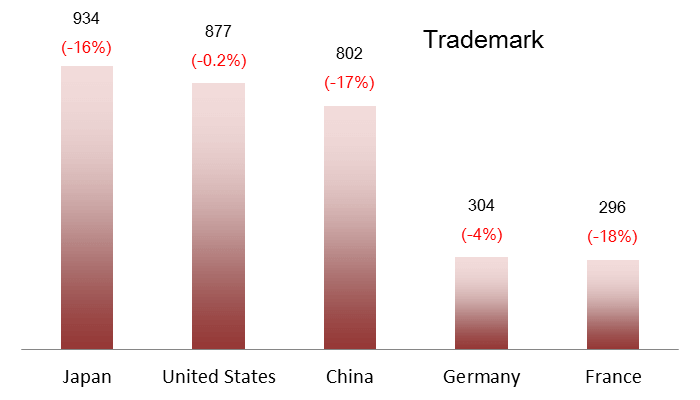
Figure 1: Top 5 Nations Filing Applications for Invention and Design Patents, as well as Trademark Registrations.
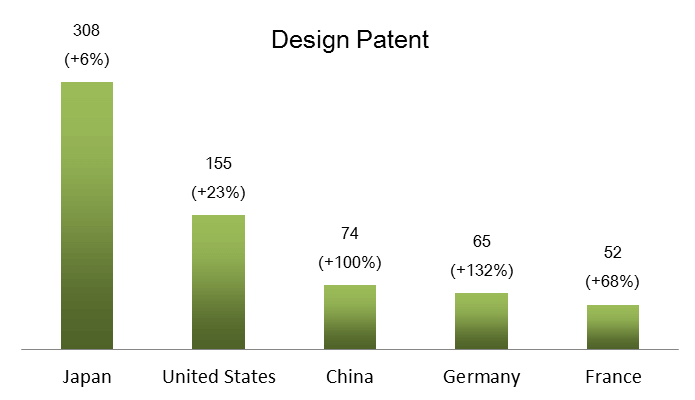
Figure 2: Top 10 Domestic (Left) and Foreign (Right) Applicants.
In the first quarter (Q1) of 2017, 17,670 new patent applications were filed, which marks a 6% growth compared to Q1 of 2016. Meanwhile, a 5% growth of new trademark registrations has been registered, corresponding to 18,976 cases. The relevant data is summarized hereunder in Table 1.
Table 1 Patent and Trademark Applications–Residents and Non-Residents.
| Patent | Q1 | Q1-Q1 | ||||||
| 2017 | 2016 | Growth Rate (%) | 2017 | 2016 | Growth Rate (%) | |||
| Total | Total | 17,670 | 16,649 | 6 | 17,670 | 16,649 | 6 | |
| Residents | 9,138 | 8,826 | 4 | 9,138 | 8,826 | 4 | ||
| Non-residents | 8,532 | 7,823 | 9 | 8,532 | 7,823 | 9 | ||
| Invention | Total | 11,174 | 10,306 | 8 | 11,174 | 10,306 | 8 | |
| Residents | 3,769 | 3,505 | 8 | 3,769 | 3,505 | 8 | ||
| Non-residents | 7,405 | 6,801 | 9 | 7,405 | 6,801 | 9 | ||
| Utility Model | Total | 4,659 | 4,551 | 2 | 4,659 | 4,551 | 2 | |
| Residents | 4,408 | 4,291 | 3 | 4,408 | 4,291 | 3 | ||
| Non-residents | 251 | 260 | -3 | 251 | 260 | -3 | ||
| Design | Total | 1,837 | 1,792 | 3 | 1,837 | 1,792 | 3 | |
| Residents | 961 | 1,030 | -7 | 961 | 1,030 | -7 | ||
| Non-residents | 876 | 762 | 15 | 876 | 762 | 15 | ||
| Trademark | Q3 | Q1-Q3 | ||||||
| 2016 | 2015 | Growth Rate (%) | 2016 | 2015 | Growth Rate (%) | |||
| Total | 18,976 | 18,033 | 5 | 18,976 | 18,033 | 5 | ||
| Residents | 14,097 | 12,890 | 9 | 14,097 | 12,890 | 9 | ||
| Non-residents | 4,879 | 5,143 | -5 | 4,879 | 5,143 | -5 | ||
For further analysis, applicants of new applications are further categorized as shown in Figures 1-3 and Table 2.
Figure 1: Top 5 Nations Filing Applications for Invention and Design Patents, as well as Trademark Registrations.
Figure 2: Top 10 Domestic (Left) and Foreign (Right) Applicants.
Figure 1: Top 5 Nations Filing Applications for Invention and Design Patents, as well as Trademark Registrations.
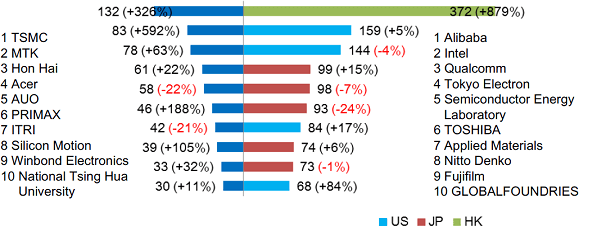
Figure 2: Top 10 Domestic (Left) and Foreign (Right) Applicants.
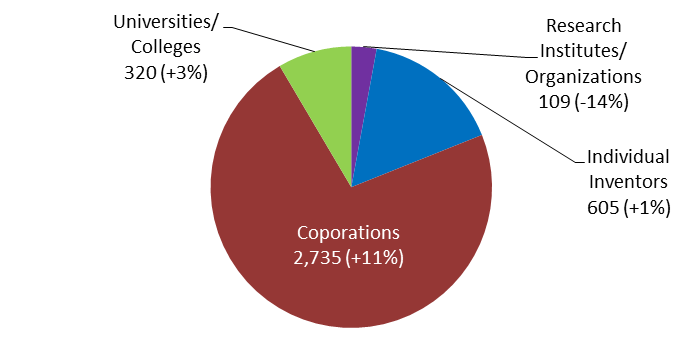
Fig.3 Invention Patent Applications Filed by Residents.
Table 2 Top Invention Patent Filing Domestic Universities.
In addition, the relevant data regarding patent grants is summarized hereunder in Table 3 as well as Figures 4 and 5.
Table 3 Patent Grants–Residents and Non-Residents.
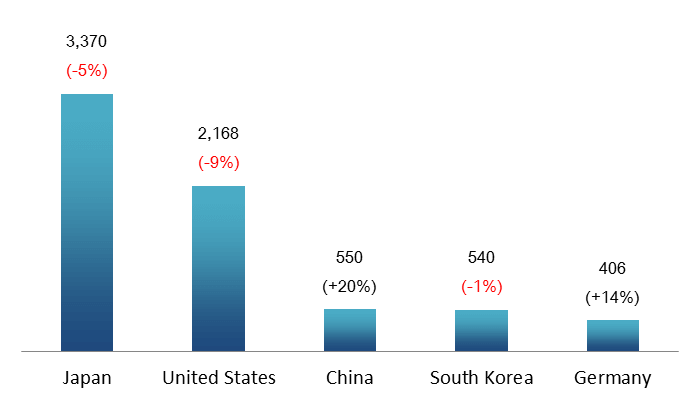
Figure 4: Top 5 Nations with regard to the Number of Invention Patent Grants.
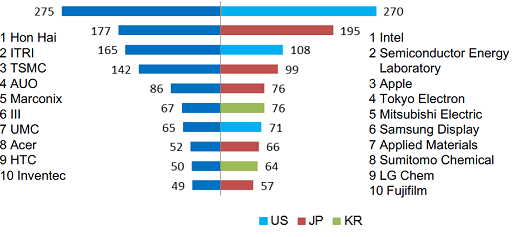
Figure 5 Top 10 Invention Patent Grants Domestic (Left) and Foreign (Right) Applicants.
TIPO kept reducing first OA pendency for invention patent applications while new applications and requests for substantive examinations have increased. In Q1 of 2017, compared to the same period last year, the numbers of both new applications and requests for substantive examinations rose by 8%, while average pendency for first OAs and average disposal pendency were reduced by 5-6% to 9 and 16 months, respectively (Table 4).
Table 4 Processing Status for Examination of Invention Patent Applications.
Note: Concluded cases for invention patents include the number of approvals and rejections and the number of applications withdrawn, dismissed, terminated, converted, and priority rights claimed.
1 Taiwan Intellectual Property Office News (May 15, 2017). Retrieved
from https://www.tipo.gov.tw/ct.asp?xItem=624823&ctNode=6687&mp=2
2 Patent Engineer in Patent Division
Figure 2: Top 10 Domestic (Left) and Foreign (Right) Applicants.
Fig.3 Invention Patent Applications Filed by Residents.
Table 2 Top Invention Patent Filing Domestic Universities.
| Rank | University | Q1 | ||
| 2017 | 2016 | Growth Rate (%) | ||
| 10 | National Tsing Hua University | 30 | 27 | 11 |
| 32 | Chang Gung University | 16 | 7 | 129 |
| 34 | National Taiwan University | 15 | 13 | 15 |
| 41 | National Chin-Yi University of Technology | 13 | 16 | -19 |
| 41 | I-Shou University | 13 | 4 | 225 |
| 47 | National Cheng Kung University | 12 | 18 | -33 |
| 49 | National Taiwan Normal University | 11 | 7 | 57 |
| 49 | Kun Shan University | 11 | 10 | 10 |
| 59 | National Chiao Tung University | 10 | 16 | -38 |
| 59 | National Taipei University of Technology | 10 | 12 | -17 |
Table 3 Patent Grants–Residents and Non-Residents.
| Patent | Q1 | Q1-Q1 | ||||||
| 2017 | 2016 | Growth Rate (%) | 2017 | 2016 | Growth Rate (%) | |||
| Total | Total | 17,923 | 19,093 | -6 | 17,923 | 19,093 | -6 | |
| Residents | 9,796 | 10,630 | -8 | 9,796 | 10,630 | -8 | ||
| Non-residents | 8,127 | 8,463 | -4 | 8,127 | 8,463 | -4 | ||
| Invention | Total | 12,130 | 12,553 | -3 | 12,130 | 12,553 | -3 | |
| Residents | 5,053 | 5,243 | -4 | 5,053 | 5,243 | -4 | ||
| Non-residents | 7,077 | 7,310 | -3 | 7,077 | 7,310 | -3 | ||
| Utility Model | Total | 4,178 | 4,674 | -11 | 4,178 | 4,674 | -11 | |
| Residents | 3,926 | 4,405 | -11 | 3,926 | 4,405 | -11 | ||
| Non-residents | 252 | 269 | -6 | 252 | 269 | -6 | ||
| Design | Total | 1,615 | 1,866 | -13 | 1,615 | 1,866 | -13 | |
| Residents | 817 | 982 | -17 | 817 | 982 | -17 | ||
| Non-residents | 798 | 884 | -10 | 798 | 884 | -10 | ||
Figure 4: Top 5 Nations with regard to the Number of Invention Patent Grants.
Figure 5 Top 10 Invention Patent Grants Domestic (Left) and Foreign (Right) Applicants.
TIPO kept reducing first OA pendency for invention patent applications while new applications and requests for substantive examinations have increased. In Q1 of 2017, compared to the same period last year, the numbers of both new applications and requests for substantive examinations rose by 8%, while average pendency for first OAs and average disposal pendency were reduced by 5-6% to 9 and 16 months, respectively (Table 4).
Table 4 Processing Status for Examination of Invention Patent Applications.
| Applications | Number of requests for substantive examination | Number of conclusions | Number pending | First OA issued | Average pendency for first OA (months) | Average disposal pendency (months) | |
| 2014 | 46,378 | 41,168 | 70,206 | 100,041 | 62,413 | 24.31 | 33.43 |
| 2015 | 44,415 | 40,489 | 68,369 | 72,510 | 59,366 | 17.68 | 26.02 |
| 2016 | 43,836 | 38,382 | 61,287 | 50,293 | 49,930 | 11.95 | 19.83 |
| Q1 2016 | 10,306 | 9,062 | 14,731 | 66,841 | 12,974 | 14.28 (Mar) | 21.48 (Mar) |
| Q2 2016 | 10,316 | 9,372 | 15,350 | 60,863 | 13,152 | 12.65 (Jun) | 20.14 (Jun) |
| Q3 2016 | 10,849 | 9,356 | 15,265 | 54,954 | 11,903 | 10.24 (Sep) | 18.73 (Sep) |
| Q4 2016 | 12,365 | 10,592 | 15,941 | 50,293 | 11,901 | 9.57 (Dec) | 17.1 (Dec) |
| Q1 2017 | 11,174 | 9,761 | 12,991 | 47,063 | 10,212 | 9.23 (Mar) | 15.84 (Mar) |
| Q1 2017 vs. Q1 2016 (%) | +8 | +8 | -12 | -30 | -21 | -5.05 | -5.64 |
1 Taiwan Intellectual Property Office News (May 15, 2017). Retrieved
from https://www.tipo.gov.tw/ct.asp?xItem=624823&ctNode=6687&mp=2
2 Patent Engineer in Patent Division